
This is the second article in a series on VTK. The first in this series can be found here. We discuss how to get setup and an overview of how VTK works.
VTK is implemented in C++, but has bindings to a several other languages. This means that it can be used directly from Python without the need to write any C++ code. The visualisation is still executing C++ to render: you get the performance of C++, with the ease of developing in Python… usually.
In most cases you have the ease of Python’s automatic memory management. On occasion you need to specify the size of some objects to allow VTK to allocate the necessary memory. This second pattern is common in C++ when dynamically allocating memory.
As well as a visualisation engine VTK provides a set of tools to read almost any kind of scientific data, in any sort of format/structure, filter that data, then render it in a 3D graphical environment.
Installation
VTK can be installed by a single pip command:
pip install vtkand only requires a single import statement to use the library from within Python:
import vtkThe VTK pipeline
Key to using VTK is to construct a pipeline. Most applications will go through these stages to create a visualisation. In 4 steps they are:
-
Reading data: A visualisation needs data to visualise.
-
Filtering and processing data: Once data is read into the pipeline it often needs further processing and manipulation before it can be packaged into an actor (don’t worry, we describe actors below).
-
Creating and configuring actors: These are objects that contain data and geometry and are arranged into a scene.
-
Assembling actors into a final render: Actors are placed in their initial positions and an interactive 3D environment is rendered.
VTK uses a theatre metaphor to describe the rendering environment. A pipeline reads data and packages it into an actor. The scene created by VTK is interactive. The user will be able to move around and rotate objects. VTK can allow the user to cut, move, and otherwise manipulate these actors to get at precisely the part of the geometry that is of most interest to them.
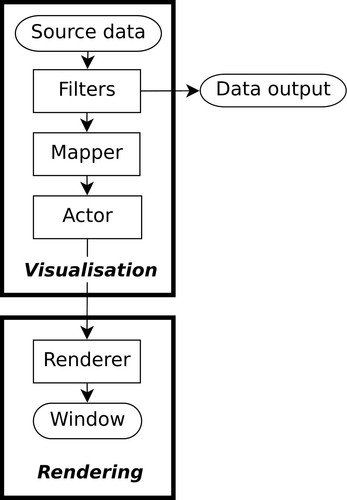
A typical VTK pipeline is shown above. Each step in the flowchart will correspond to at least one and possibly several objects instantiated from the VTK library.
The official VTK documentation distinguishes between what it calls the visualisation pipeline and the rendering pipeline. A rendering pipeline is required to create a visualisation so the distinction is not too important. Once an actor is created the focus is on rendering.
The terms visualisation pipeline or rendering pipeline used below correspond to the relevant sections in The VTK visualisation and rendering pipelines. and VTK pipeline corresponds to the entire pipeline.
We noted that every visualisation starts with a source of data that is read and processed. There are many formats for which readers are already implemented in VTK. Once data has been read it is then connected to the next stage of the pipeline. This process of connecting filters together into a pipeline is central to understanding VTK and how it works.
Filters are algorithms that transform data in some way. Their use is optional, but you will likely use several of them when constructing your visualisation pipeline. To chain together elements in a pipeline you follow the pattern of obtaining the output port of the source and connecting it to the input of the next object in the pipeline. This is common in VTK: filter2.SetInputConnection(filter1.GetOutputPort()). Here the output of filter1 is connected to the input of filter2.
The moment filters are chained together as shown above they do not actually process any data. You have only described the relationship between filters that will be used later. Their computations on data only take place when a request is made from further down the pipeline, usually at the moment the visualisation is rendered. Evaluation is lazy, so it only takes place when needed. When an update is called, the update moves up the pipeline and processed data moves back down towards the rendering steps of the pipeline.
This way of chaining filters together with lazy evaluation is the recommended way to create a pipeline. Some objects have a method .SetInputData(data) which reads a source of input data once and does not automatically update if changes are made to the data source. This should not be used if that data is ever expected to changed.
Continue here to create our first visualisation with VTK.