
This is article 3 in a series on VTK. The first in this series can be found here. We create our first visualisation using VTK.
Let’s get started with a simple example. The following is the VTK version of, "hello world." We will render a single cone in 3D. Although simple, it covers the main steps to create a rendering pipeline. Once understood it becomes very straightforward to then create much more complex scenes.
Scientific visualisation usually takes data collected from the real world. This is data overlaid across the geometry of the subject of interest. Creating and manipulating 3D geometry is important to create 3D visualisations.
For this first example we will use one of VTK’s predefined geometries. These are simple geometric shapes: arrows, cylinders, cubes, etc. which can be useful when representing data. Their names follow a convention: vtkXXXXSource where XXXX is the name of the shape, i.e., Cone, Arrow, Cylinder, etc. In this case our data source is a cone.
cone = vtk.vtkConeSource()The cone geometry is described with a small number of parameters. We set these using methods on the cone including .SetRadius(radius) or .SetResolution(facets) which set the radius of the cone and the number of facets that are used in the final model. The model is made of many geometric cells, but these are generated from the parameters that we define.
There is an intermediate step before geometry data can be attached to an instance of vtkActor. We create a mapper from our geometry, then connect that mapper to the actor.
Here the output of a cone is connected to a mapper to continue the pipeline.
mapper = vtk.vtkPolyDataMapper()
mapper.SetInputConnection(cone.GetOutputPort())
The idiom above was discussed in the previous section on the VTK pipeline. The output of cone is connected to the input of mapper. An instance of the vtkPolyDataMapper class requires a connection from an object that outputs unstructured polygon data. Such an object could be an instance of vtkPolyData which stores each point and cell or in this case vtkConeSource where the geometry is generated procedurally from a small number of parameters. Alternatively, the output of cone could be connected to a filter, with the output of the filter connected to the mapper. No filters are used in this example.
The process to attach a mapper to an actor is a little different to the input/output port pattern described earlier. Here the mapper instance is set directly.
actor = vtk.vtkActor()
actor.SetMapper(mapper)
A mapper is an intermediate step in the visualisation pipeline. A mapper takes multiple pieces of data and feeds this to an actor. We saw how geometry is set to a mapper. Other data can include parameters that define how data is mapped to a colour (see lookup tables below), or whether to use cell data or node data to colour a model.
In VTK the actor is considered the end of the visualisation pipeline (see above regarding the VTK pipeline). The actor is concerned with how the model fits into the scene. Therefore texturing, lighting, positioning of the actor are set directly with actor methods. From here we are building the rendering pipeline.
Finally we have the last steps to complete the visualisation.
window = vtk.vtkRenderWindow()
# Sets the pixel width, length of the window.
window.SetSize(500, 500)

interactor = vtk.vtkRenderWindowInteractor()
interactor.SetRenderWindow(window)

renderer = vtk.vtkRenderer()
window.AddRenderer(renderer)

renderer.AddActor(actor)
# Setting the background to blue.
renderer.SetBackground(0.1, 0.1, 0.4)

window.Render()
interactor.Start()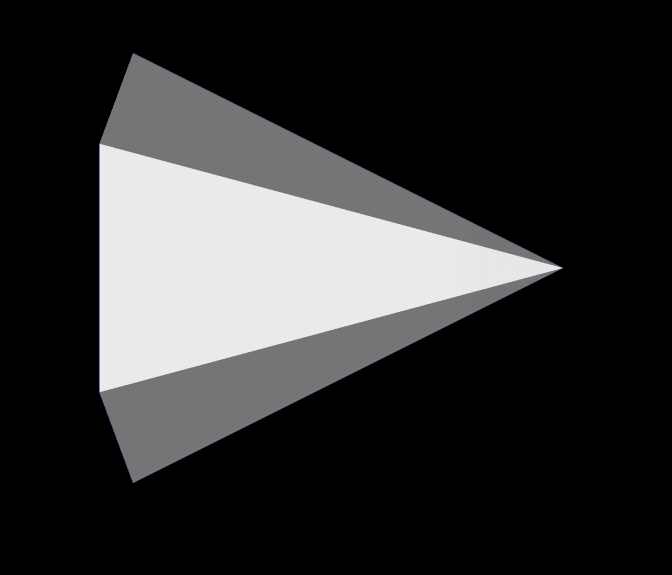
Some interactivity is enabled by default in a VTK render. Additional interactivity features need to be enabled or programmed. When the user interacts with the visualisation taking actions like clicking/moving the mouse, pressing keys, etc. these events are handled by the interactor. Different interactor settings can be used to change how the visualisation responds to particular user events. Here we used the common vtkRenderWindowInteractor. Other interactors have different behaviours. An interactor needs to be connected to a window using the .SetRenderWindow() method.
Each VTK visualisation requires a window and each window requires at least one renderer (although multiple renderers per window are possible). The window is represented by the vtkRenderWindow instance. A renderer can be considered a separate scene. Each can have different actors, camera positions, lighting etc. A renderer is connected to a window by the .AddRenderer(renderer) method. By default the entire window area will feature the output from this renderer. It is however possible to set multiple renderers to draw in different regions of the window. If multiple renderers are used, a rectangle must be specified which describes the portion of the window on which the renderer will draw. This is controlled using .SetViewport( (x0, y0, x1, y1) ).
The background colour for the renderer is set using the .SetBackground() method. The final steps initialise the visualisation.
Continue here for a description of the data models used in VTK and how most efficiently to create our first visualisation with VTK.